
GIS Day and World Town Planning Day · Nov. 12, 2026
Storytelling with Maps
Stephen Stirling
Data Editor, The Philadelphia Inquirer
About me
Stephen Stirling
- Current data editor at the Philadelphia Inquirer, where I manage data for the newsroom and edit a team of three reporters and developers.
- Graduated from Rowan University, Class of 2006. Served as editor-in-chief of the Whit.
- Became a data journalist in 2011. Learned about GIS through editors, colleagues, conferences and a network of data journalists around the country.
- Geographers, planners and journalists often find themselves in the same datasets with similar goals. I hope we can learn from one another.
About me
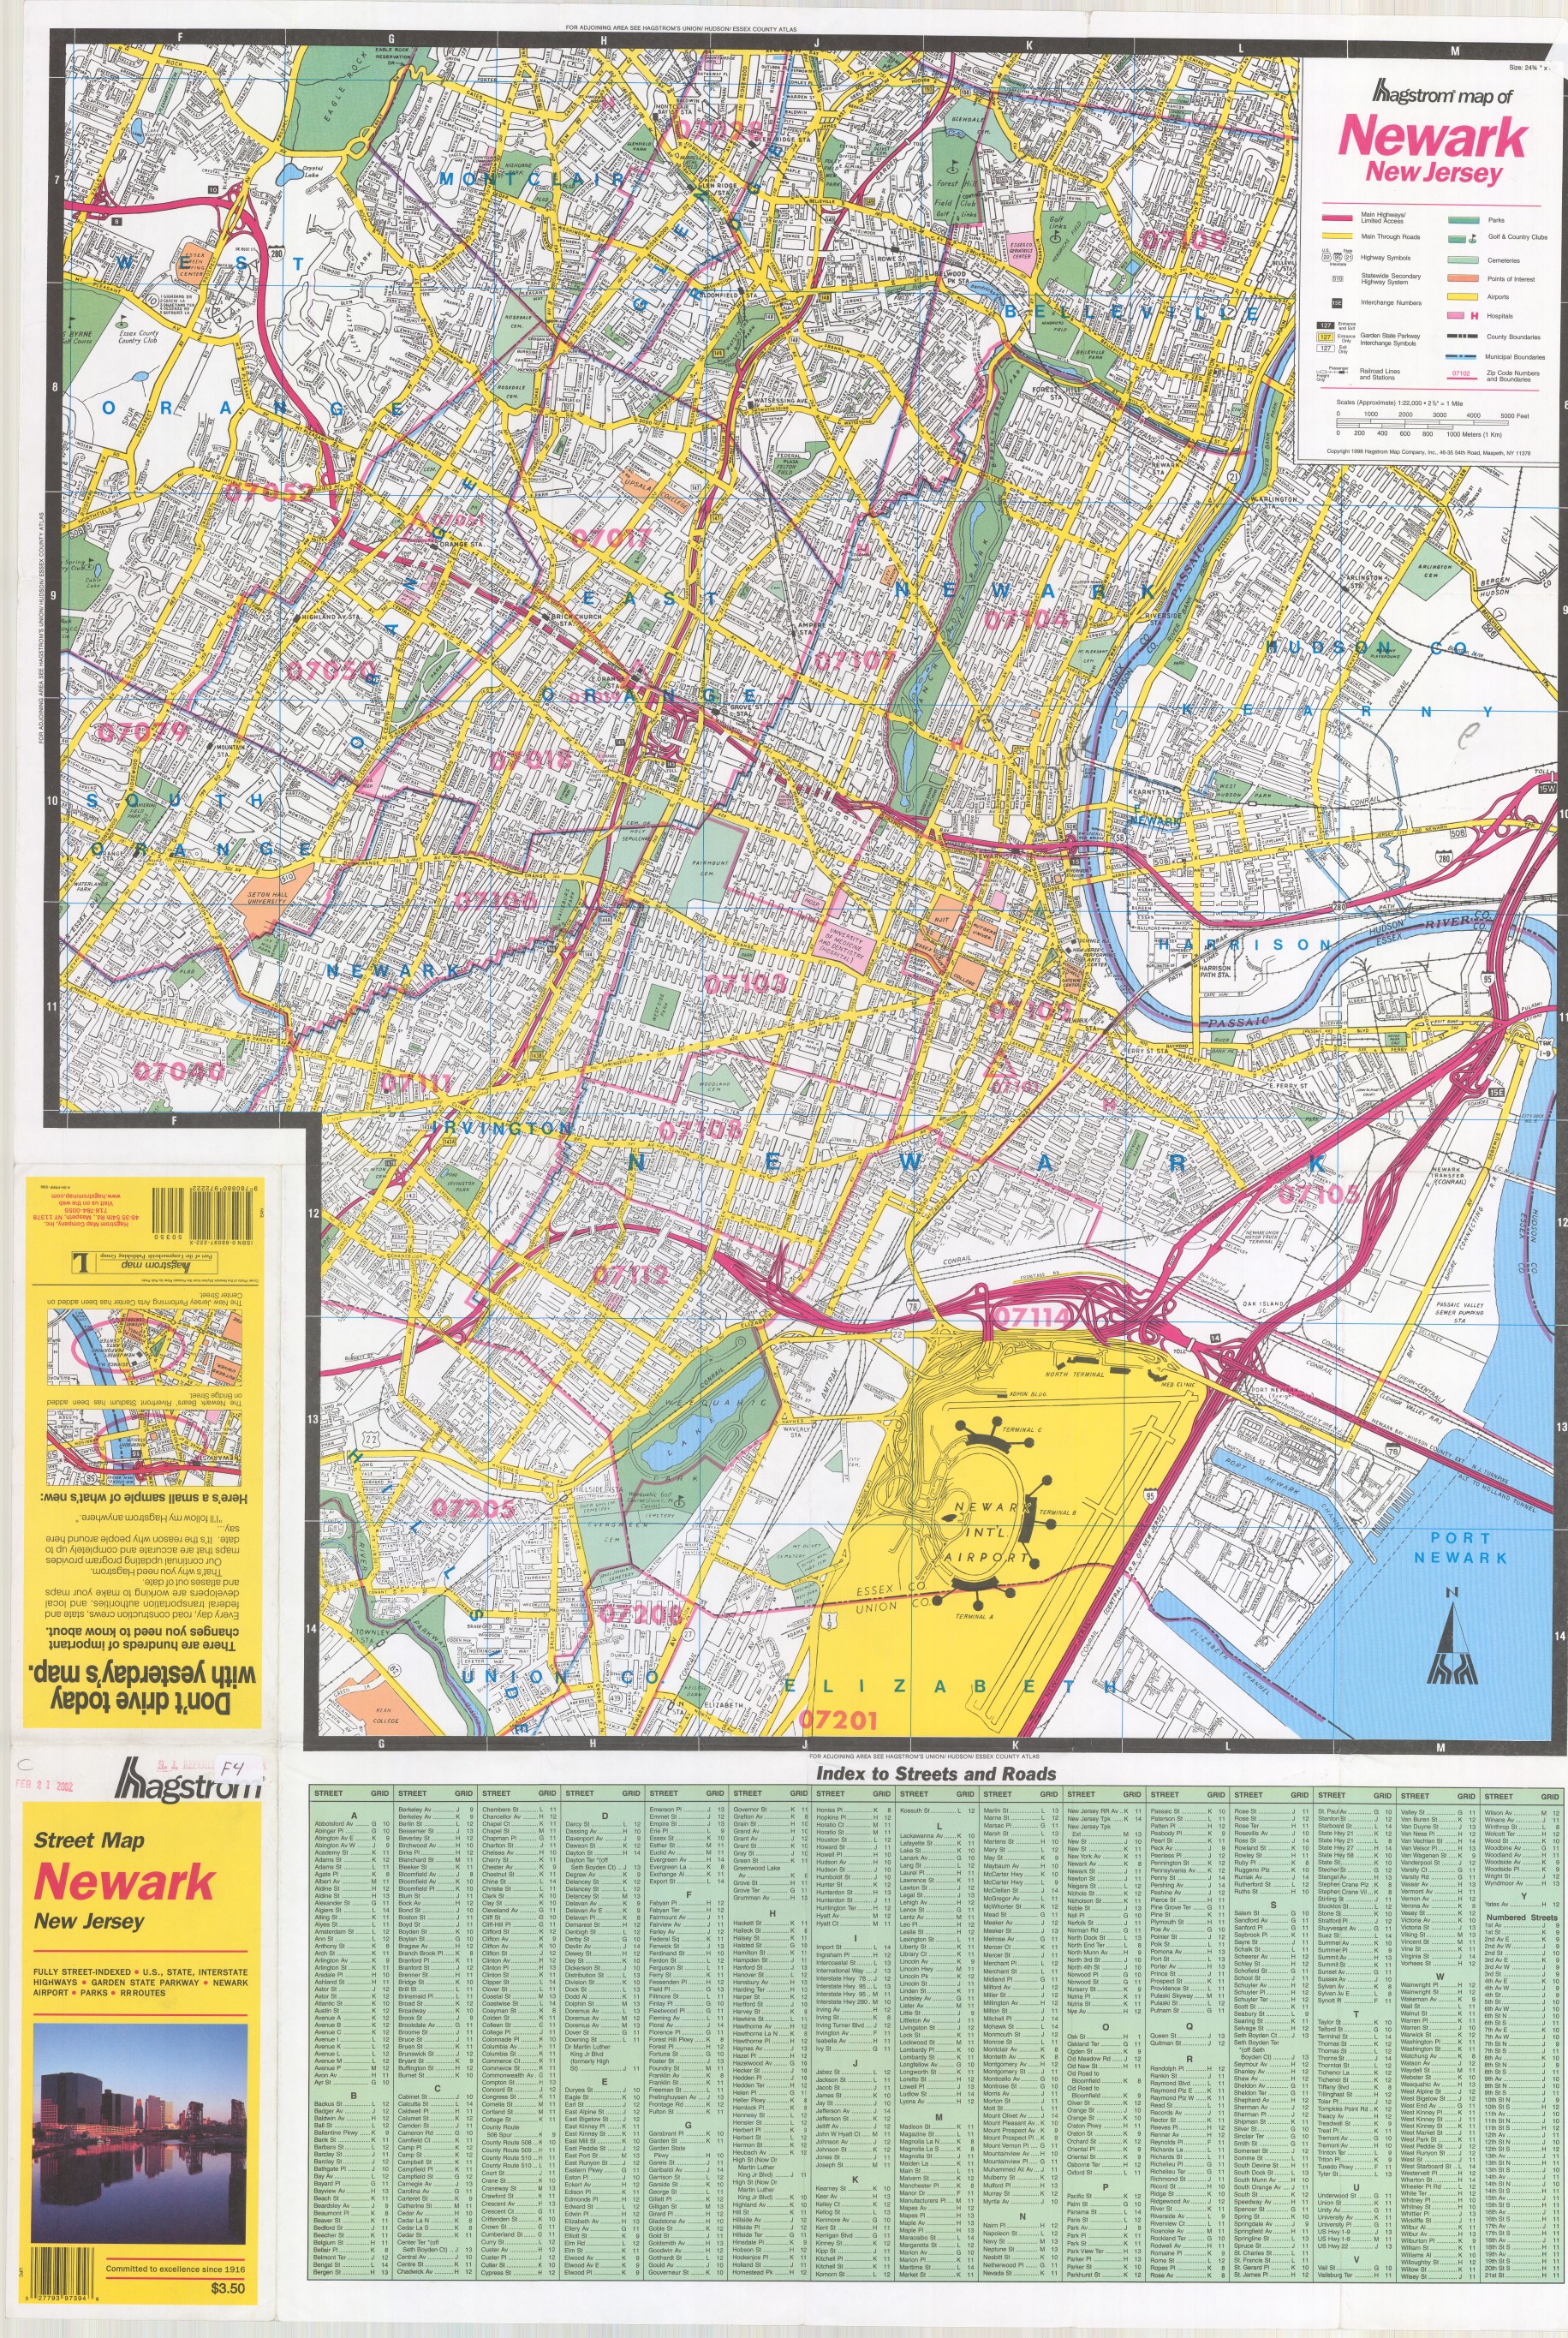
I started my journey with paper maps
As a pizza deliveryman, this is how I got around.
Maps in news
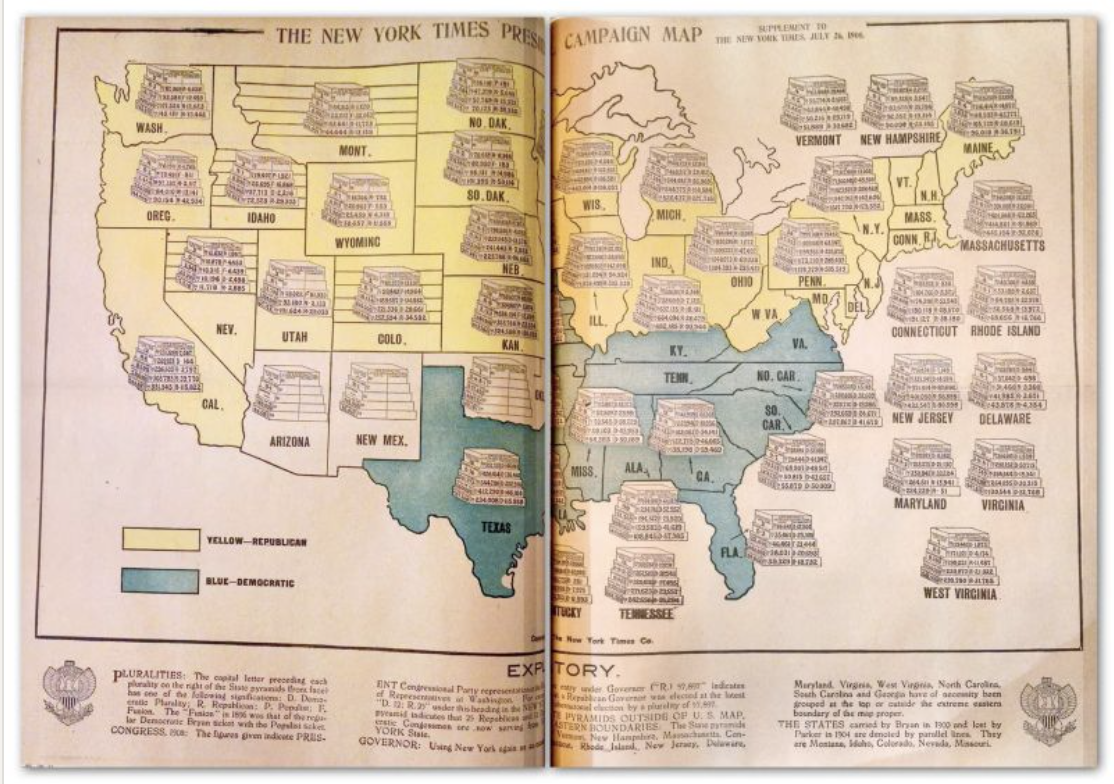
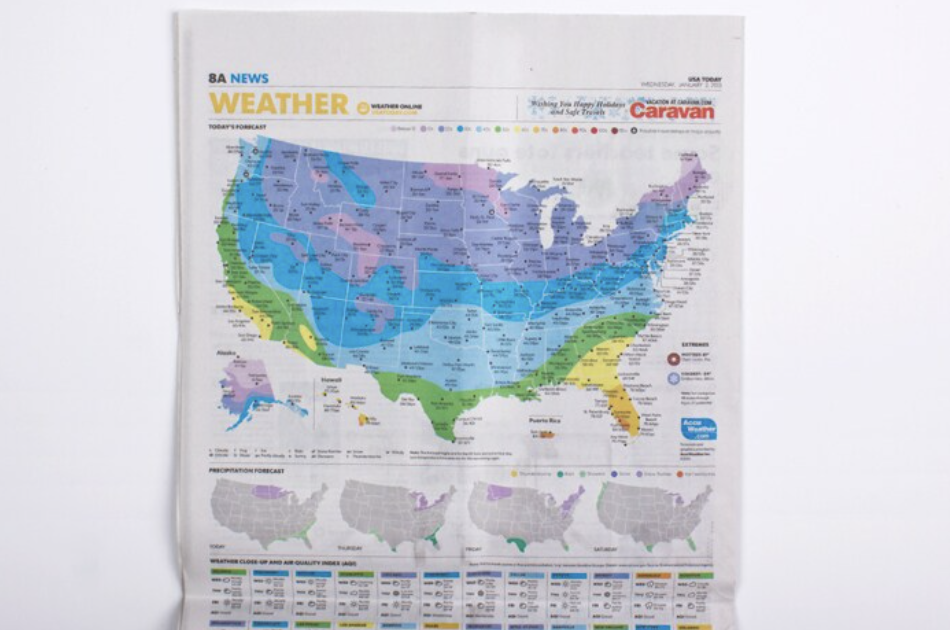
Maps in print
The digital transition
From print to digital static maps to live data
Then
Maps and visuals increase in use over the 20th century in the print industry, providing key context and a sense of place. As print production improves, they get more complex and sometimes drive coverage.
Next
Digital static
Mapping becomes ubiquitous in the internet age as technology improves and learning curves come down. Tools allow GIS to become more accessible.
Now
Live data
Maps update themselves with new data and can better cater to readers’ needs. Anyone with some determination can make a professional-level map.
At the Inquirer
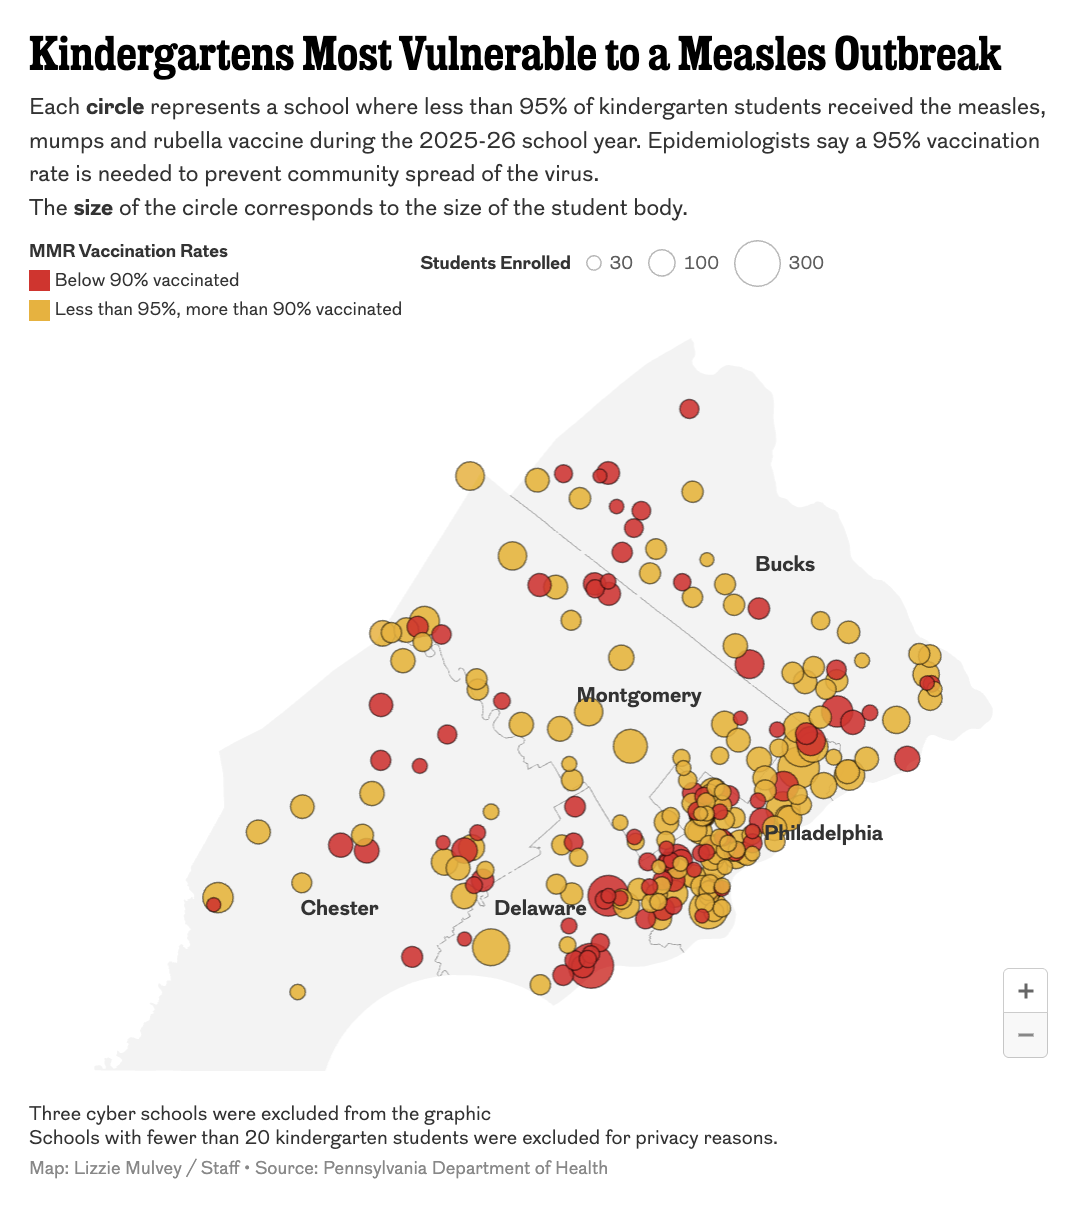
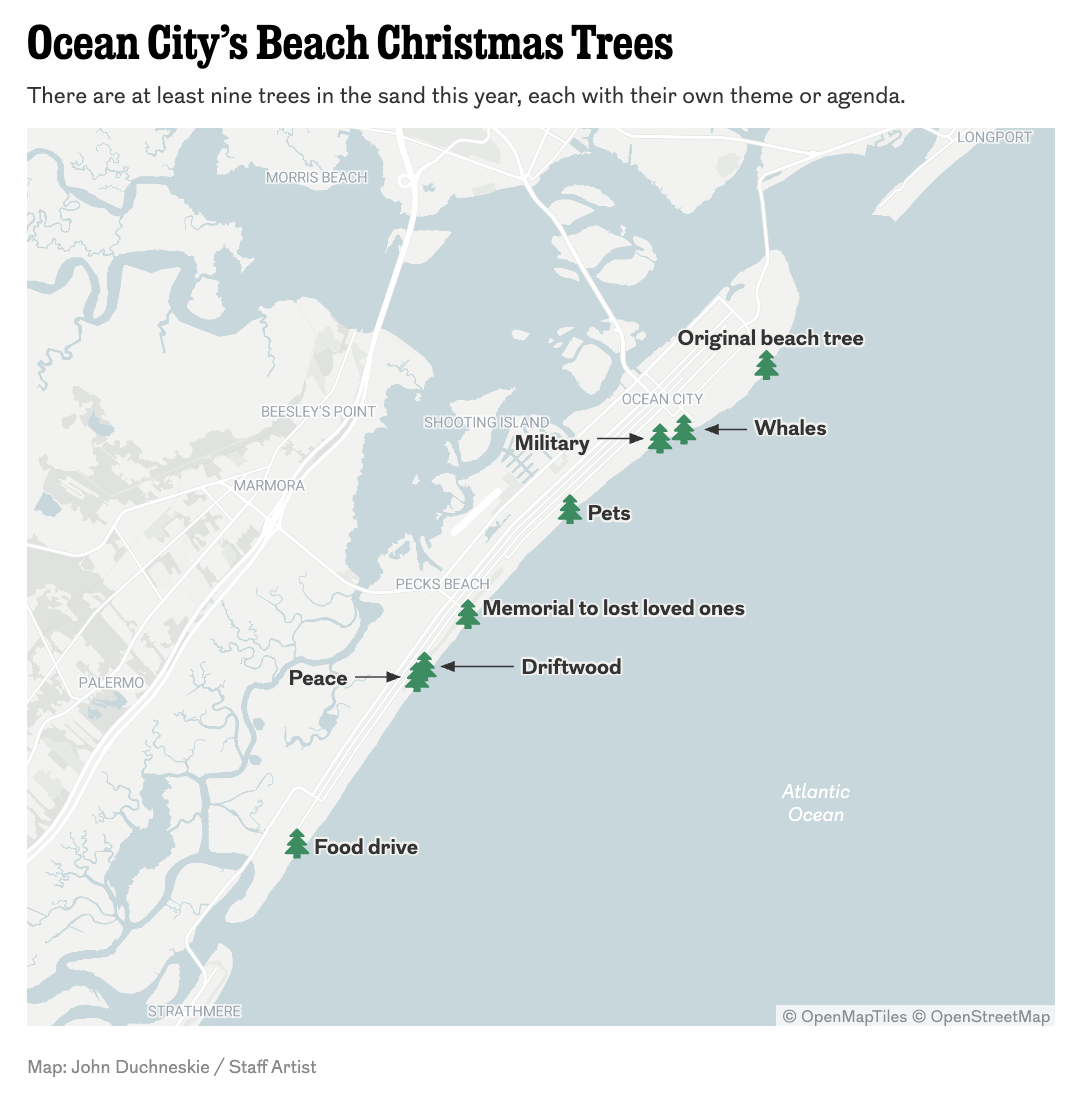
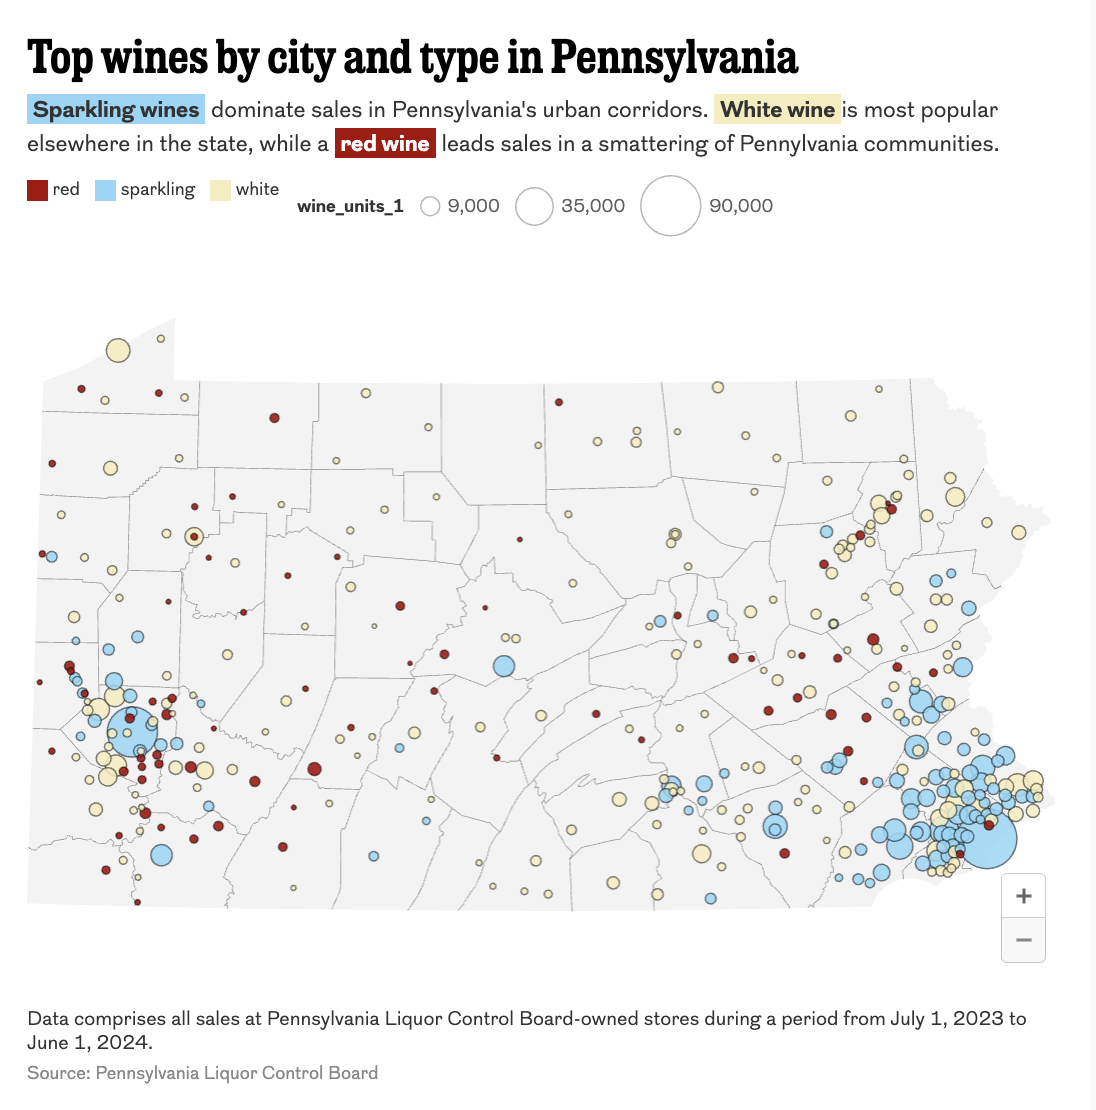
Maps give our readers a sense of place


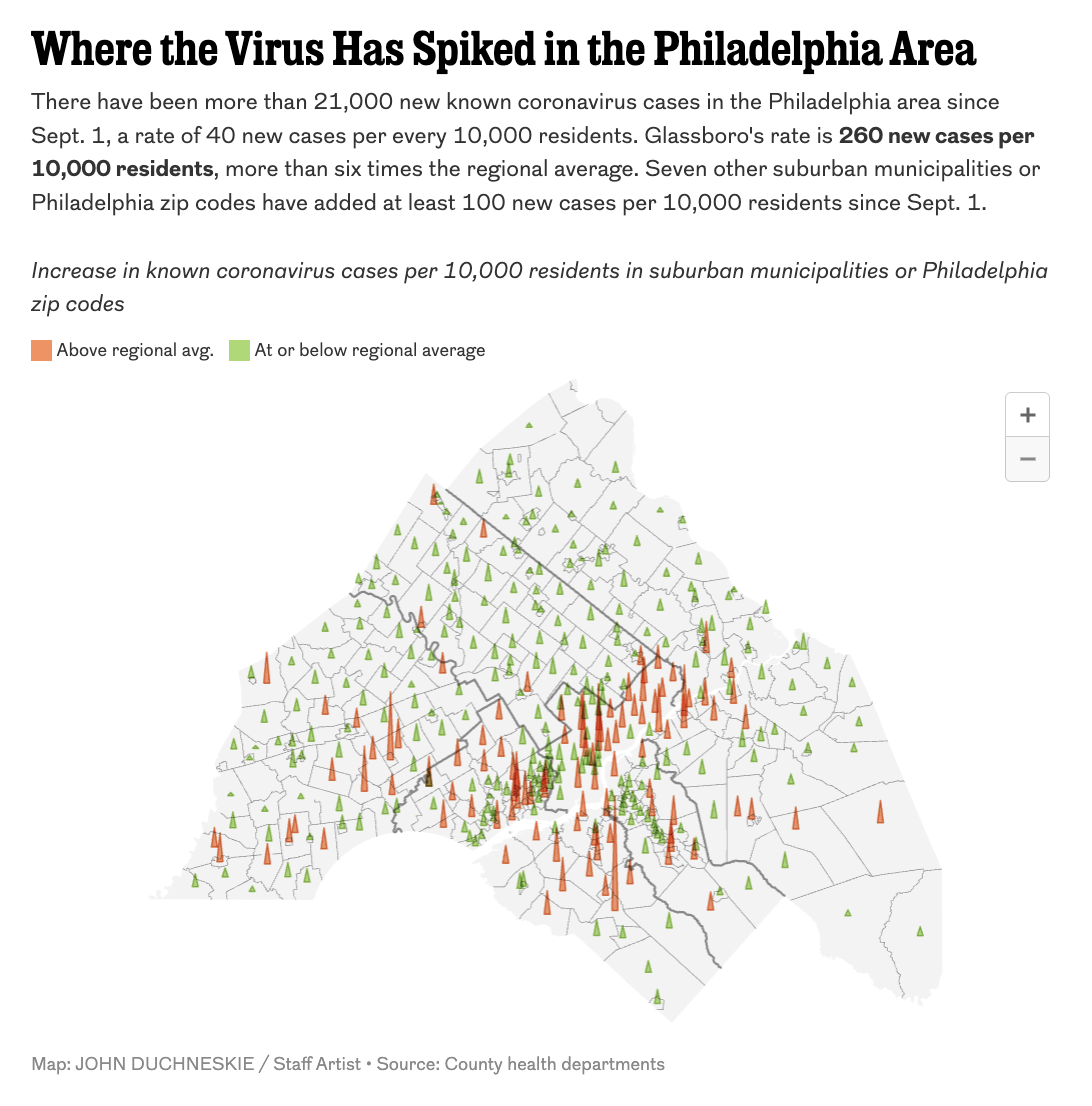
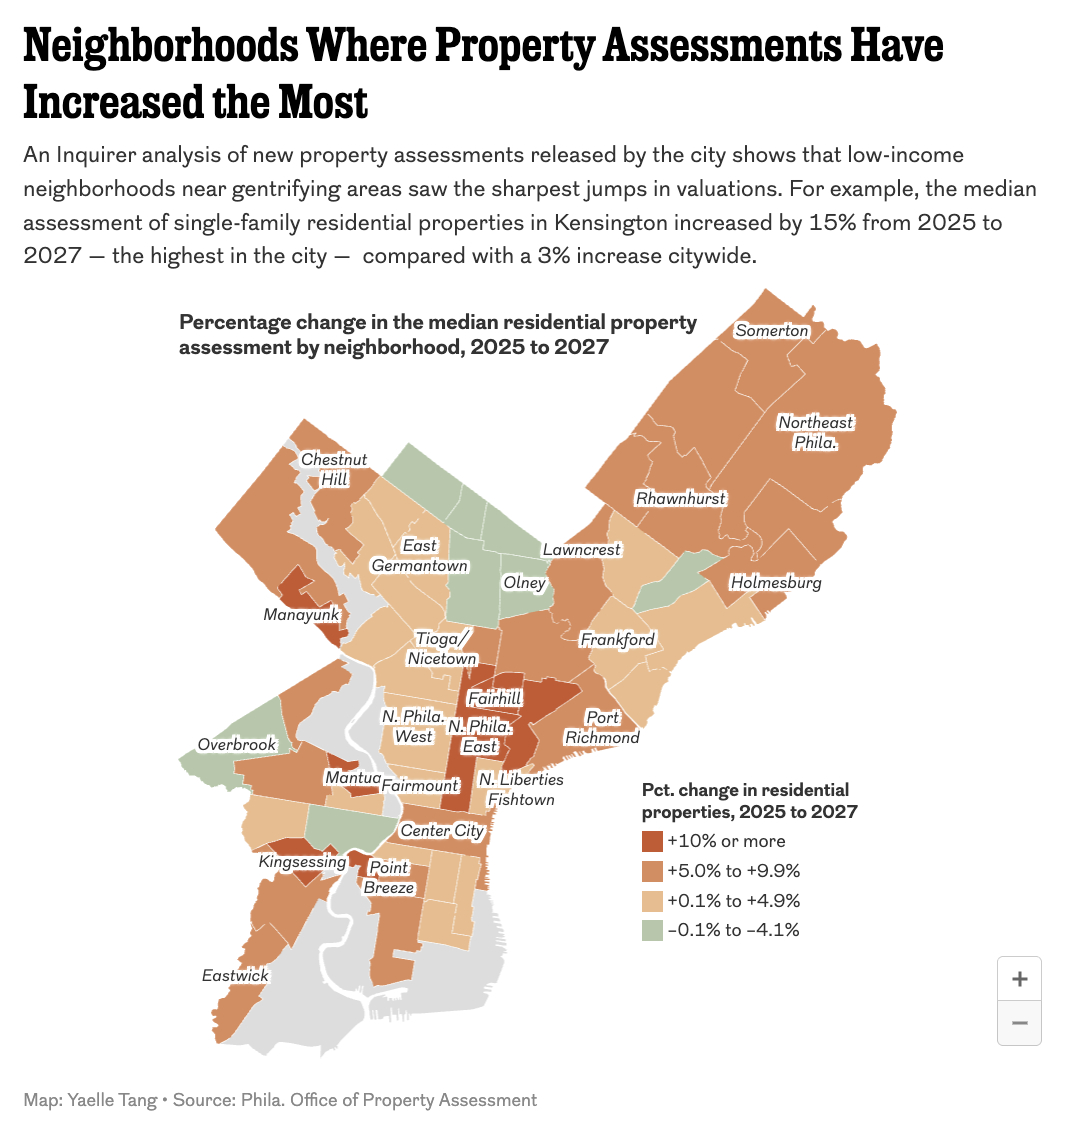
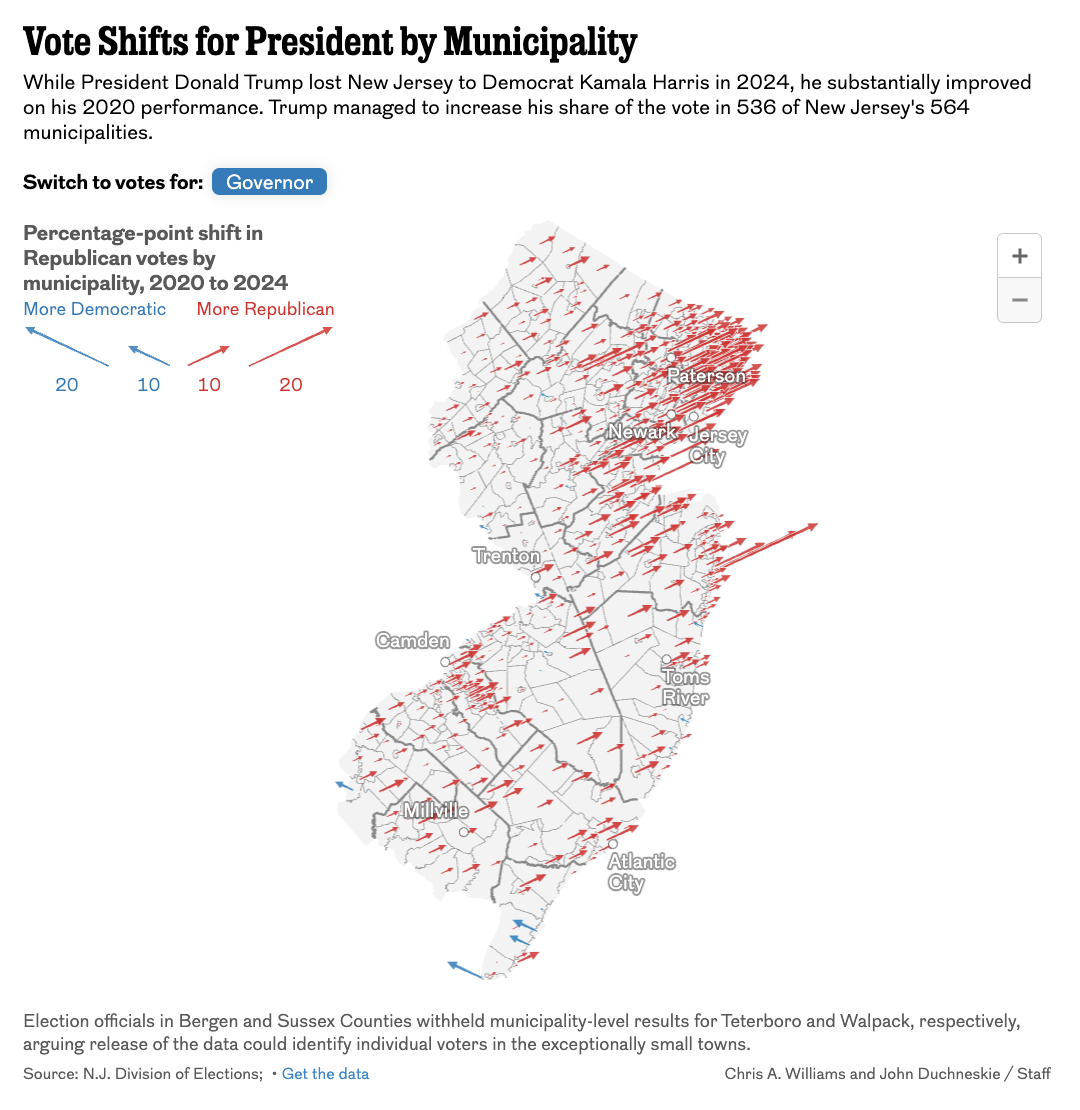
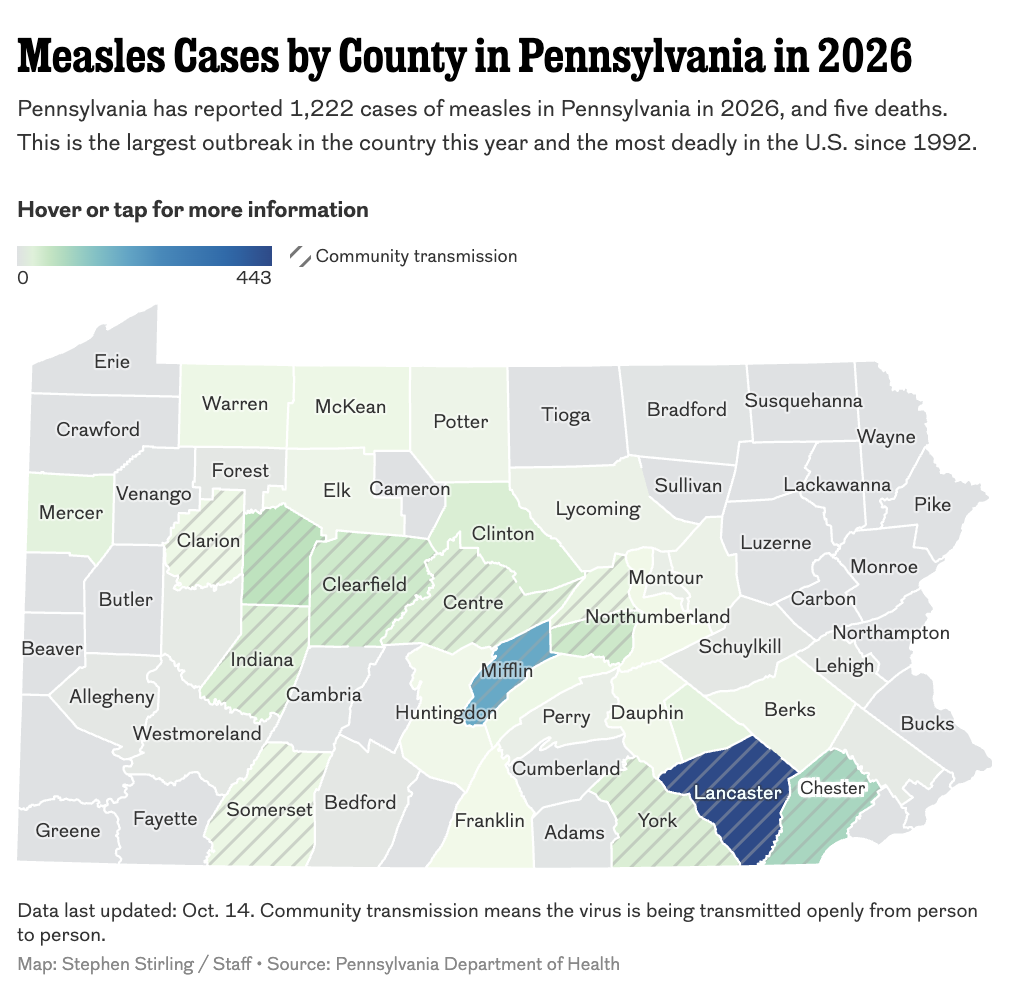
Maps Philadelphia Inquirer staff
My approach
Start with data, not a map
- We make lots of different kinds of visualizations and do lots of different analysis at the Inquirer. We use maps when they fit.
- Interview your data. Find out what you have, what you’re missing. Think about how someone might interpret it visually.
- Sometimes geography is the story, sometimes it isn’t.
- For us, a map is a late decision, not an early one.
Data <> GIS
It’s a two-way street
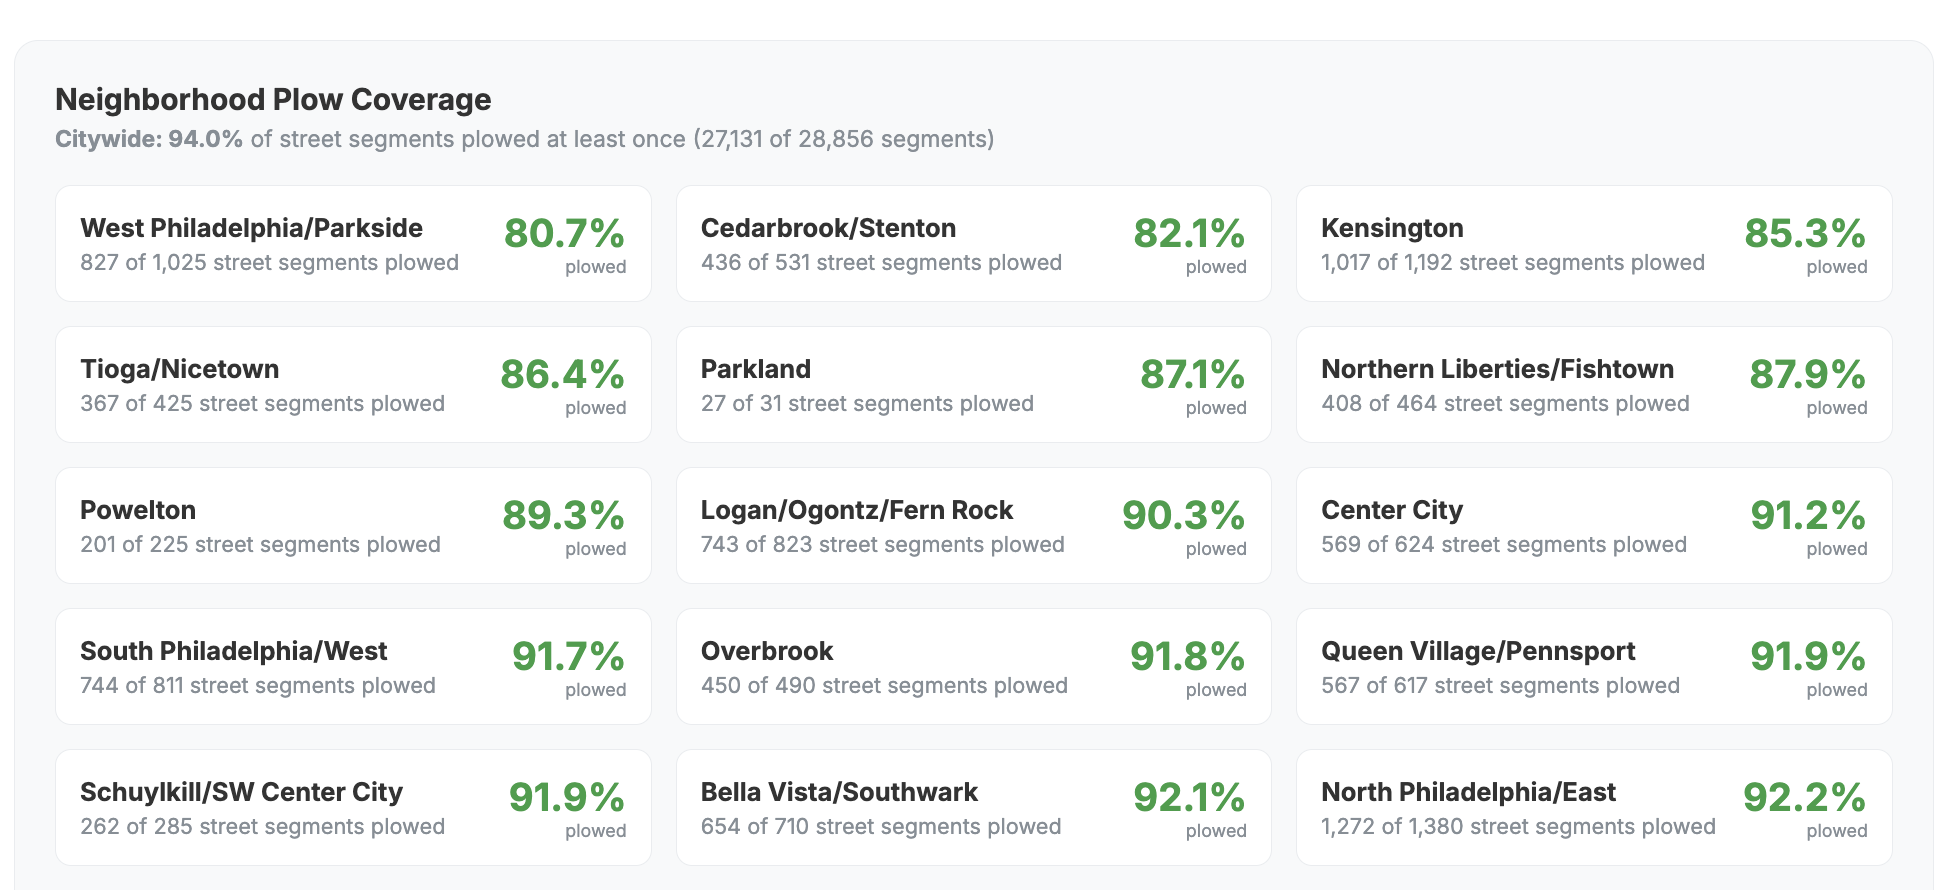
Sometimes geography is the story, but a map still isn’t the answer. This is GIS work too.
Putting people in places
Every ICE transfer from NJ and PA
Loading map…
Loading map…
Geographic analysis
Philly’s phones won’t stop buzzing
Loading map…
Showing change
Wildfire smoke
Live data
The Philadelphia Weather Machine
Loading…
Illustrating cultural disputes
The true borders of North, Central and South Jersey
Loading map…
AI <> GIS
A new frontier, with new heights and risks
- AI brings new opportunities for building on skills.
- AI is NOT a replacement for foundational knowledge.
- We use AI to boost our work with transparency and oversight.
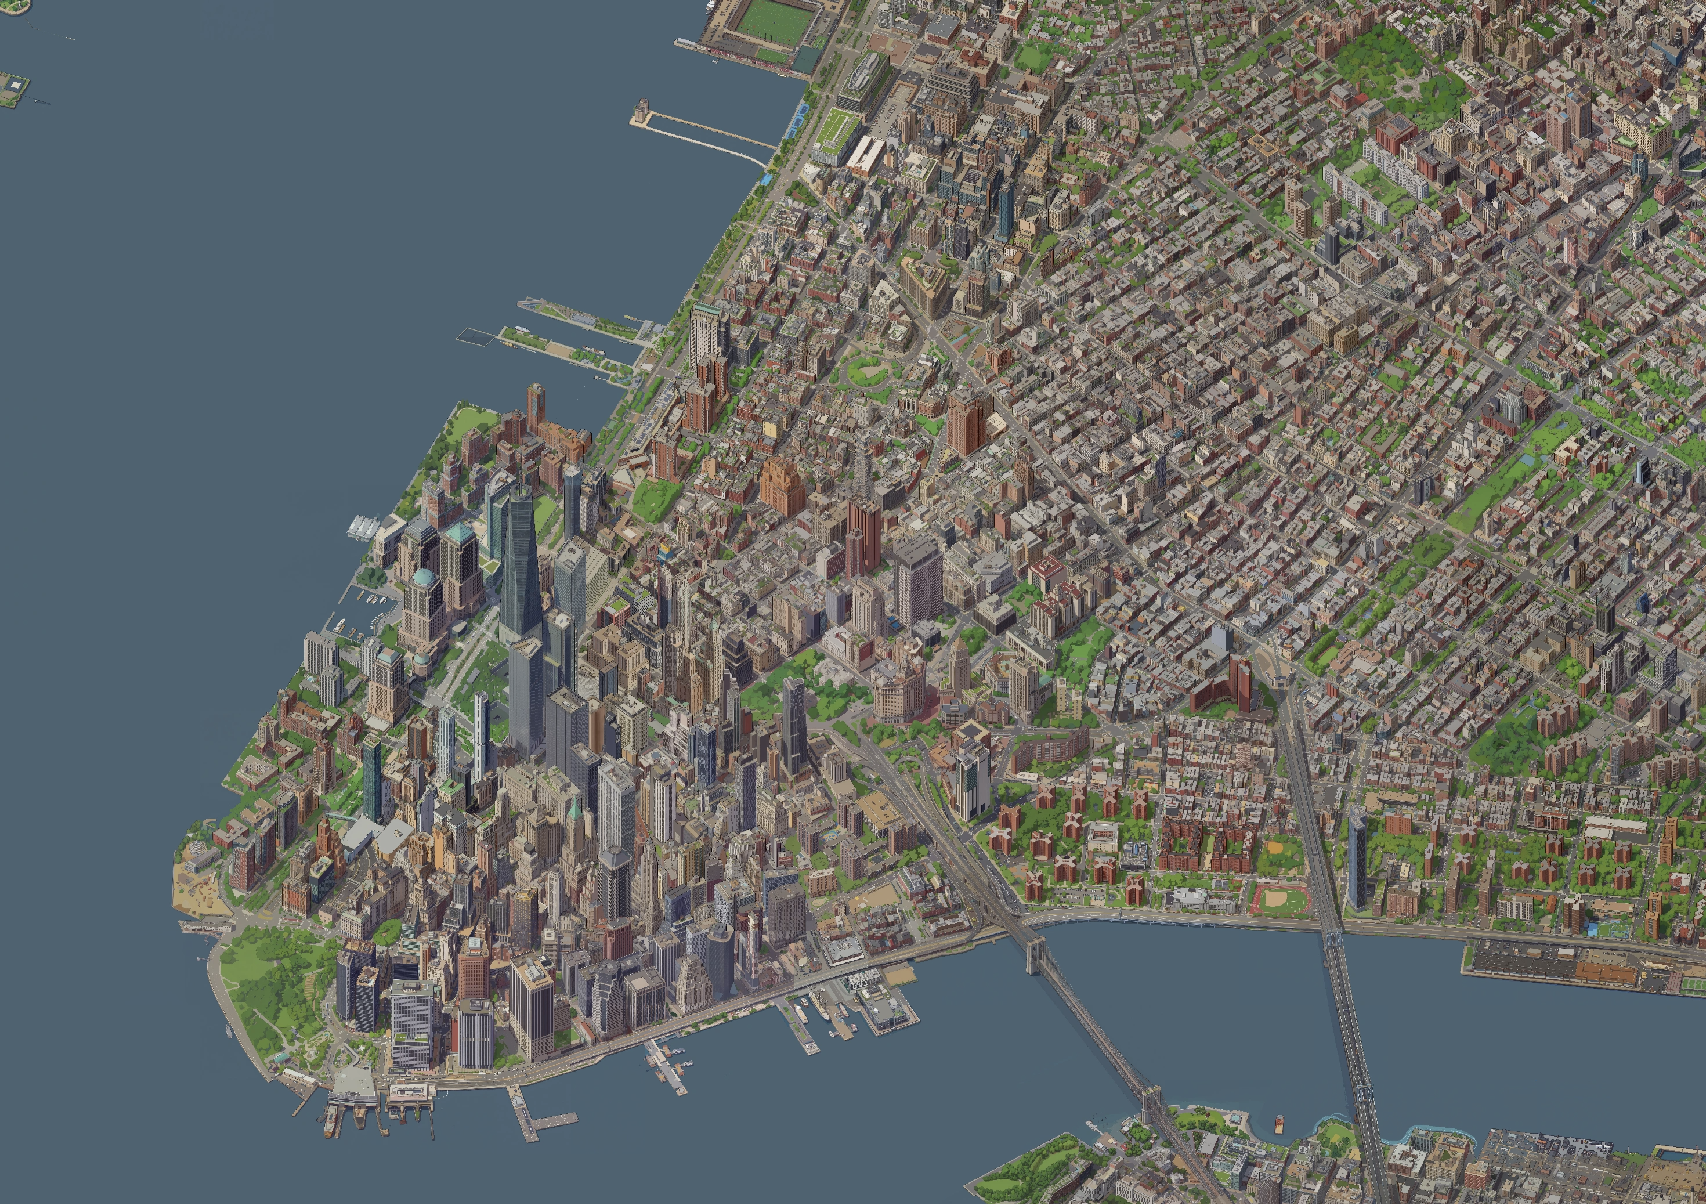
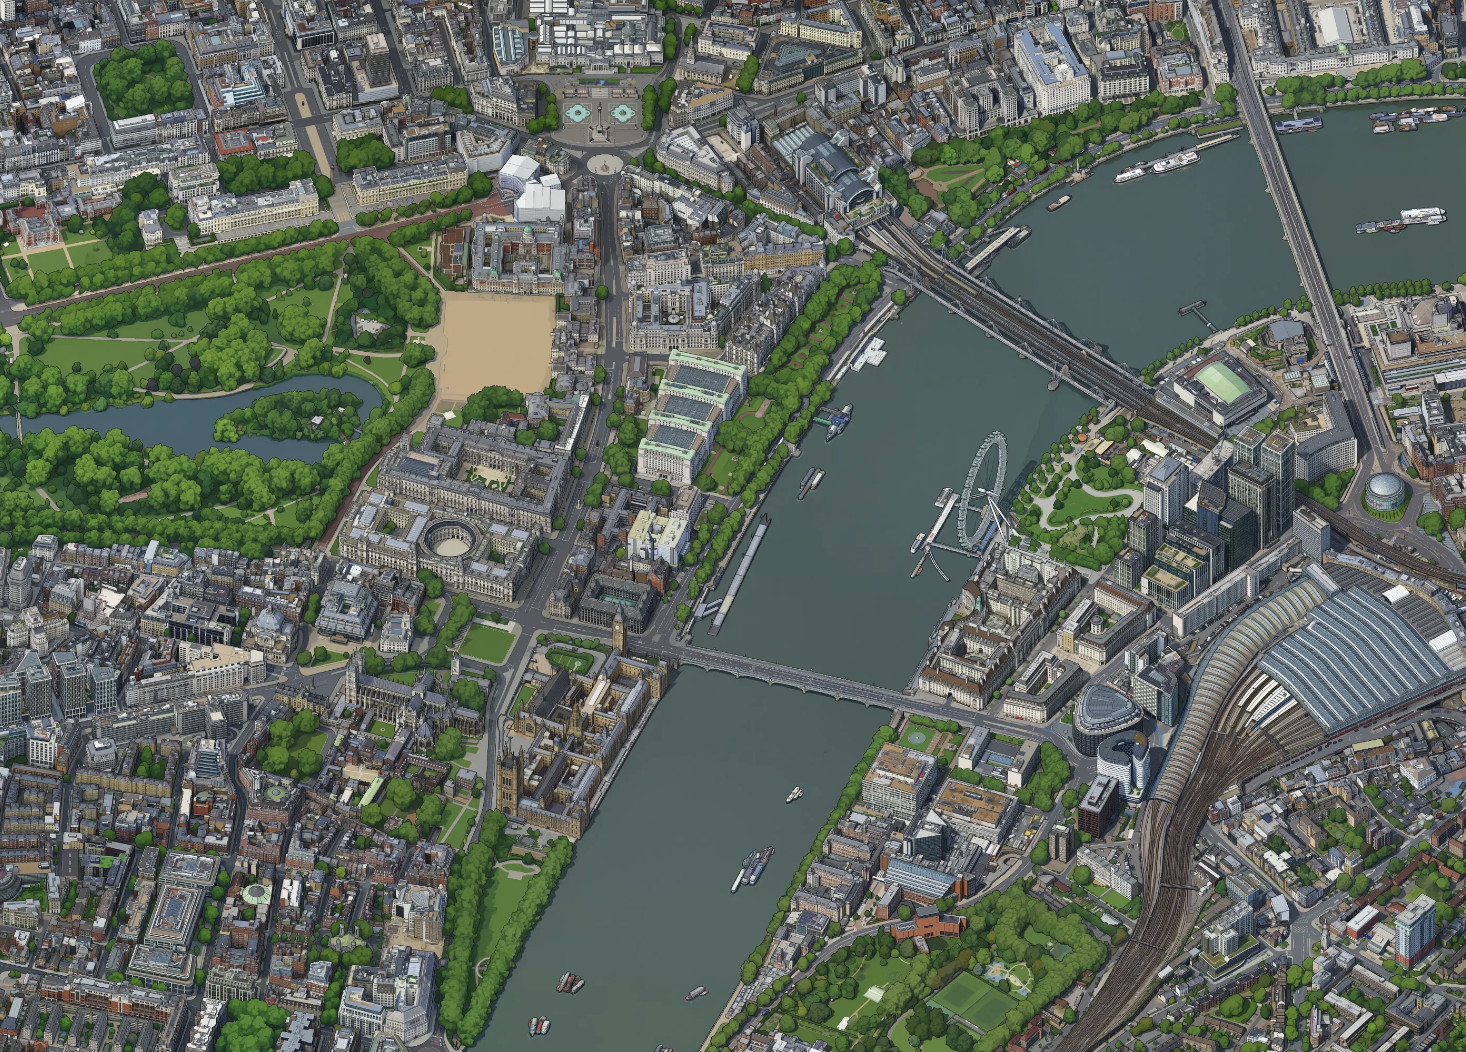
Exploring Isometric Philly
Executing an idea for this talk
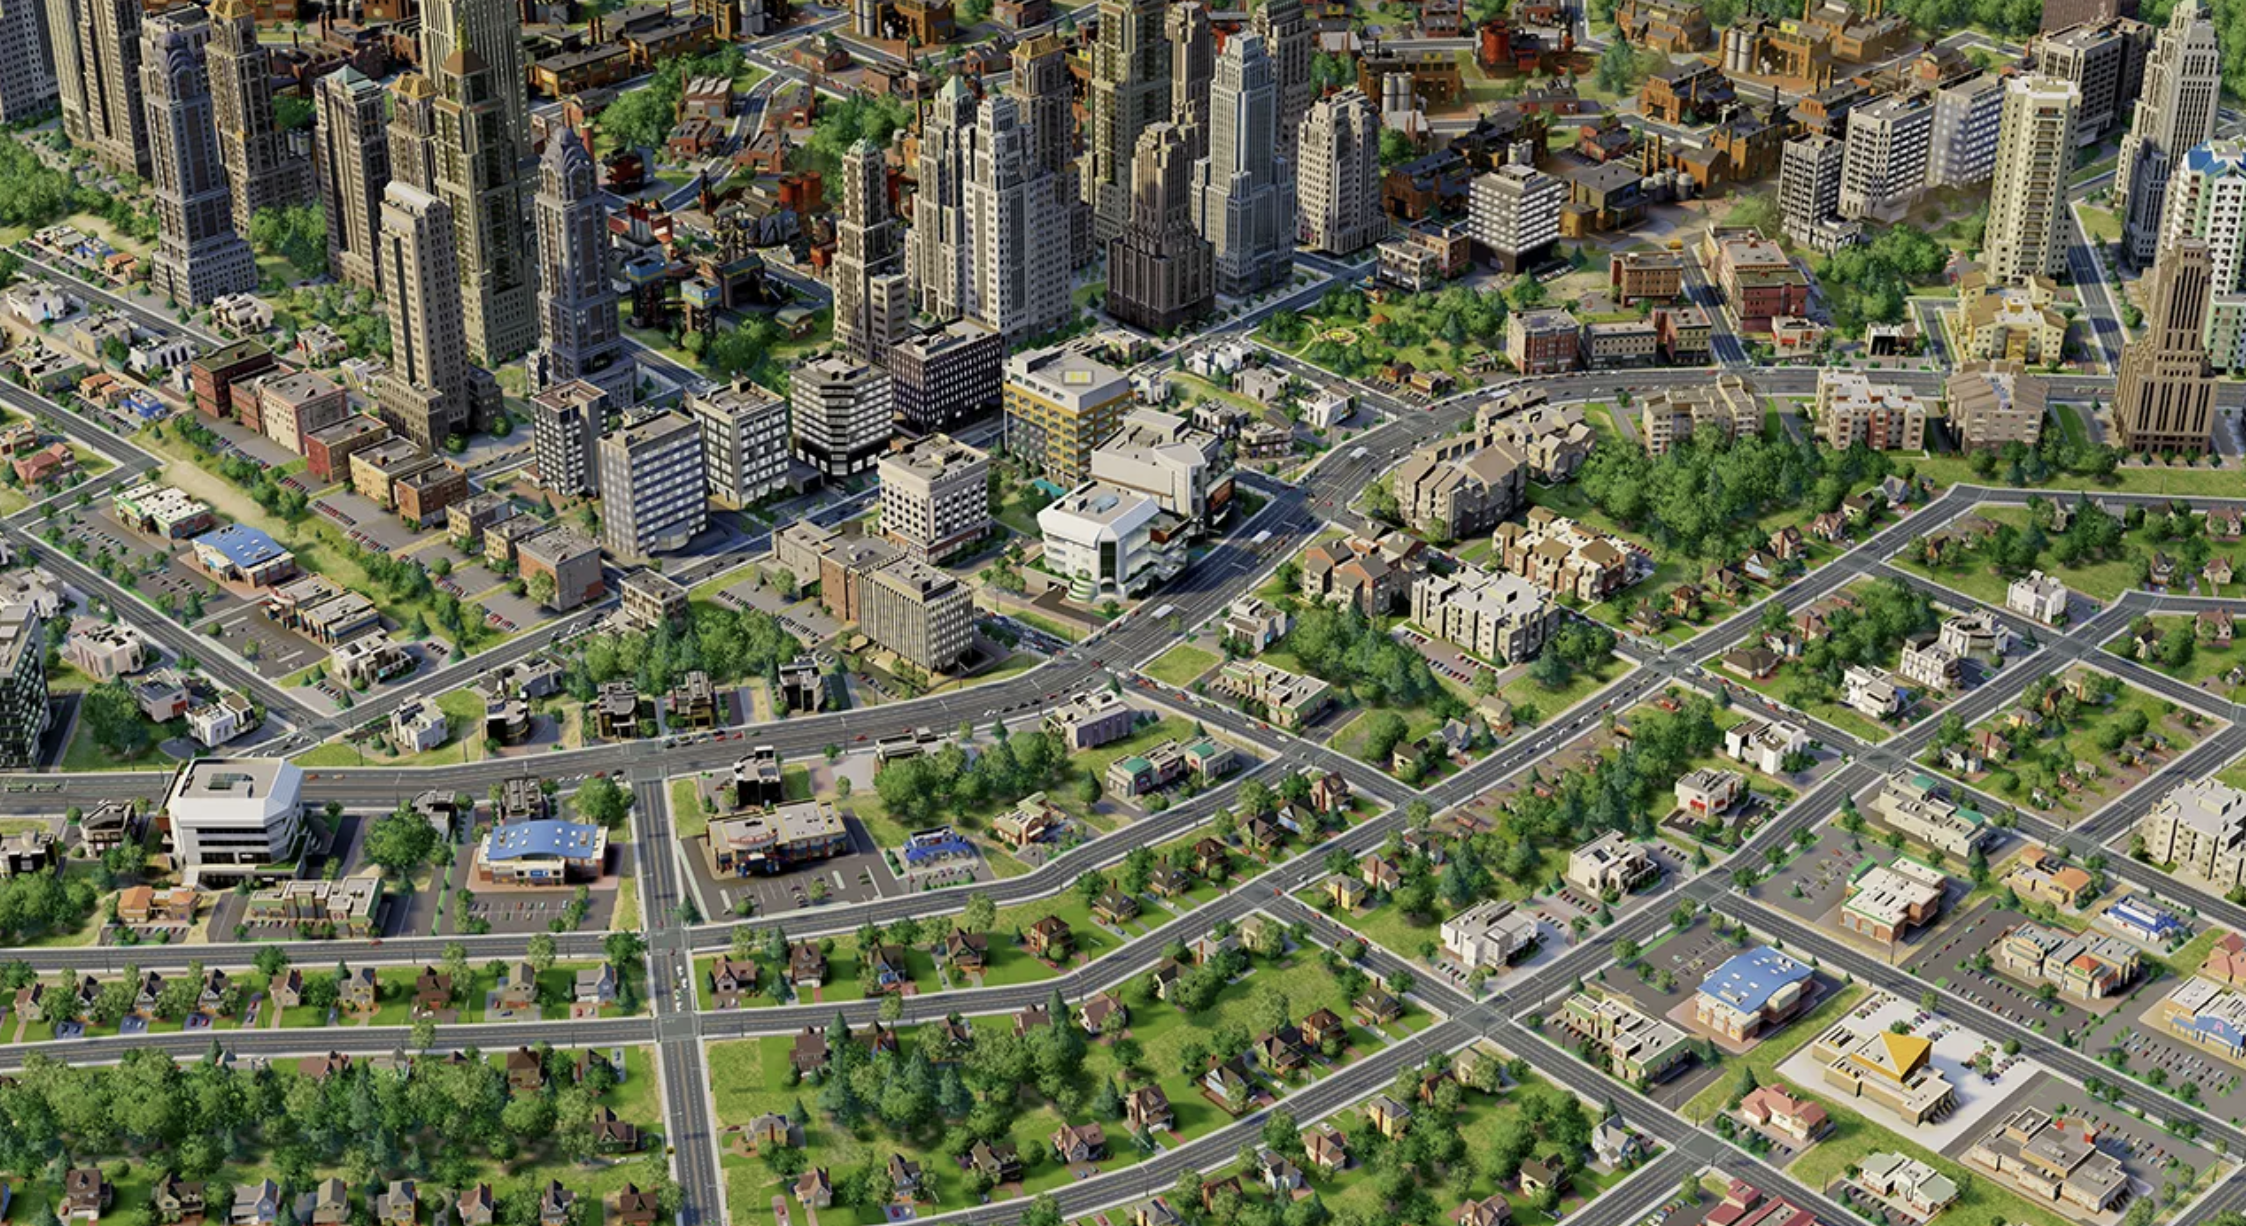
Building Sim Philly
Exploring Isometric Philly
It’s been built, but can it be built with public data?
Exploring Isometric Philly
Gathering the data
- Building footprints, tree inventory, roads and rails — things that gave us our initial layout.
- Aerial imagery, LiDAR, building height data — things that give us shape and distinction.
- Property data for information on facades, windows, storefronts, etc. Public photos of landmarks to shape individual details.
Exploring Isometric Philly
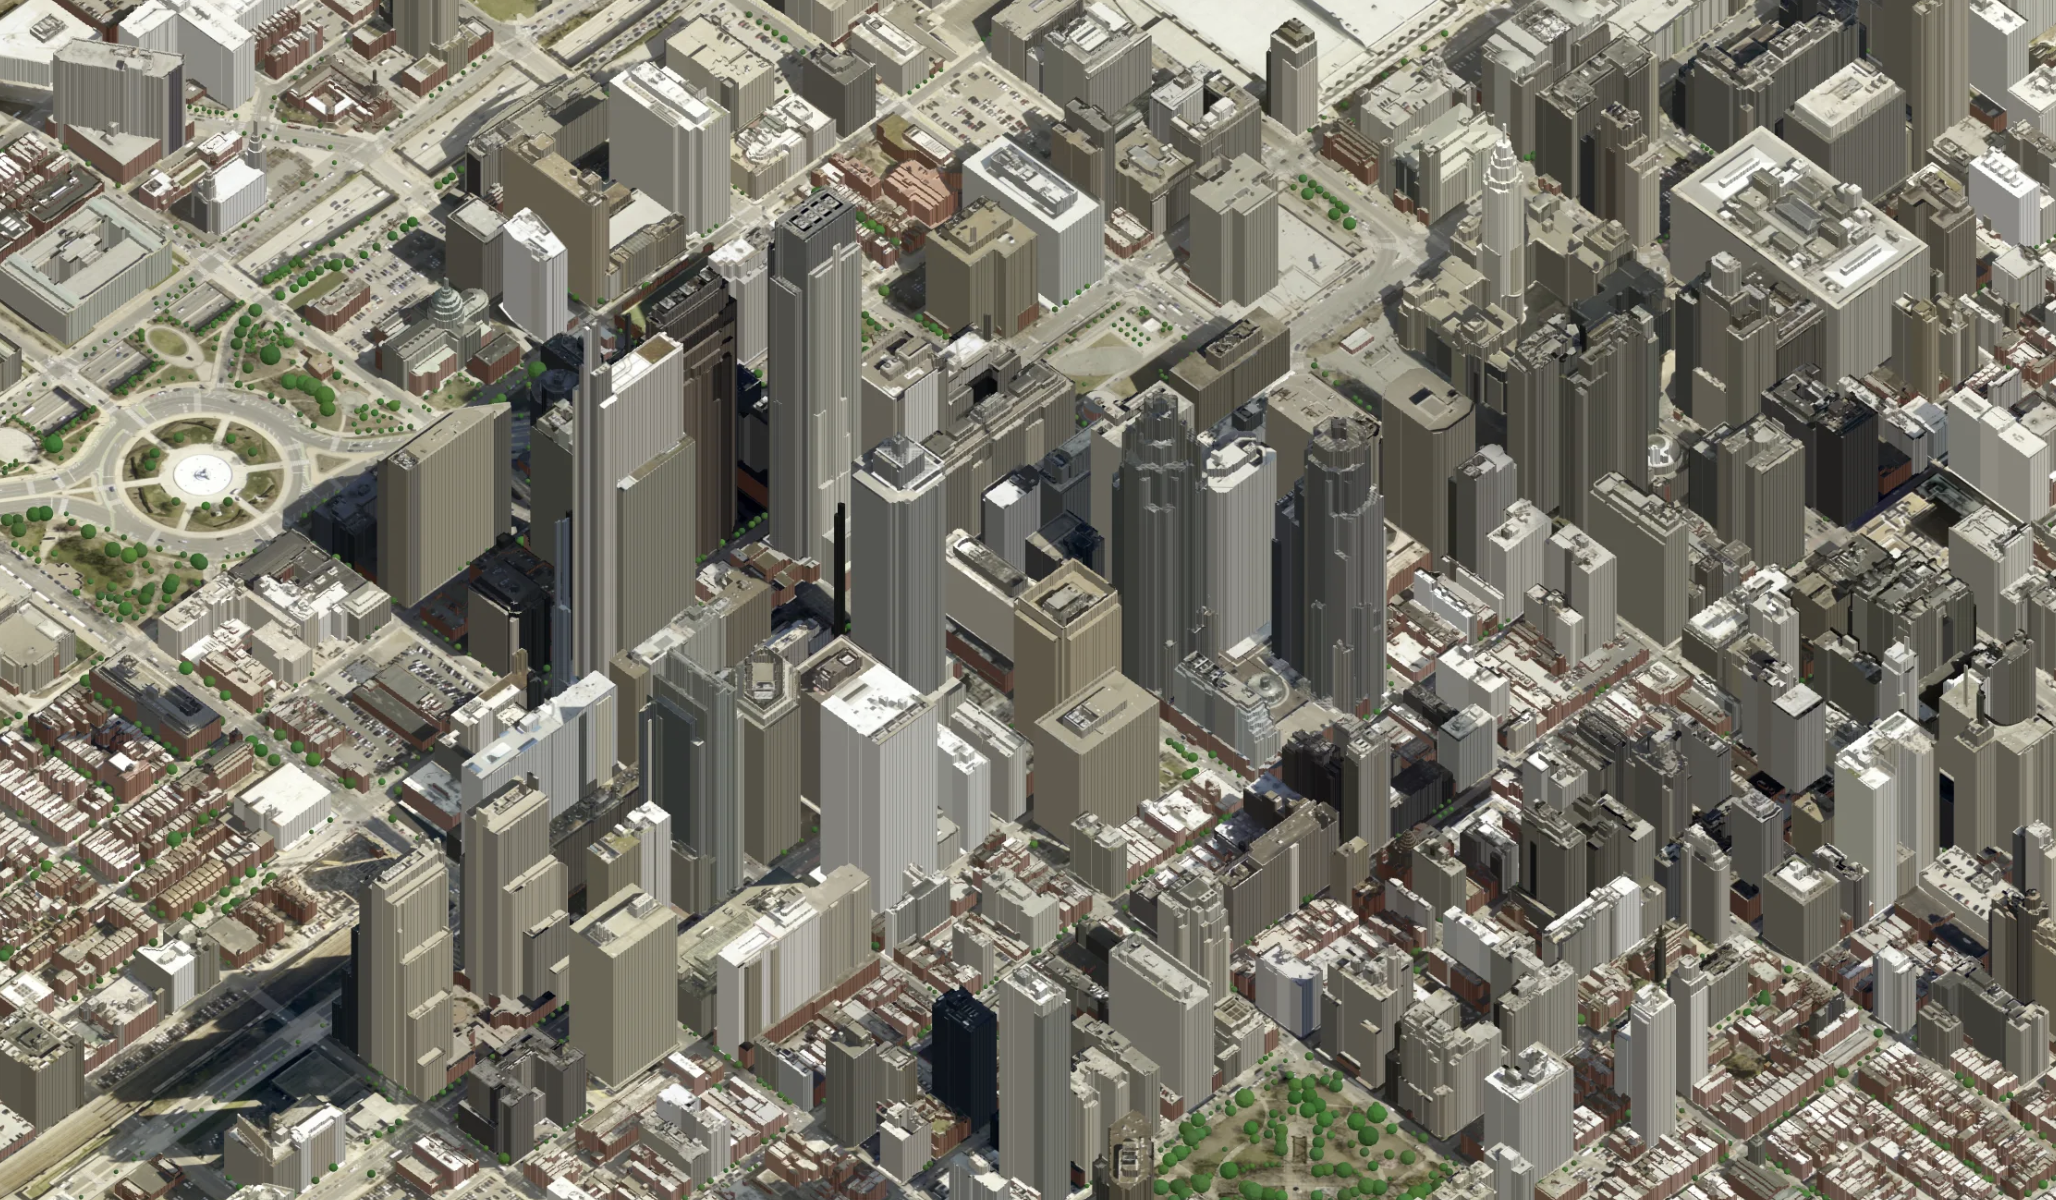
Building a base model
- Work in segments; LiDAR data is very large.
- Extrude buildings and other surfaces through footprint data and LiDAR.
- Add trees, roads and other infrastructure.
- Still missing: Facade/window/siding data.
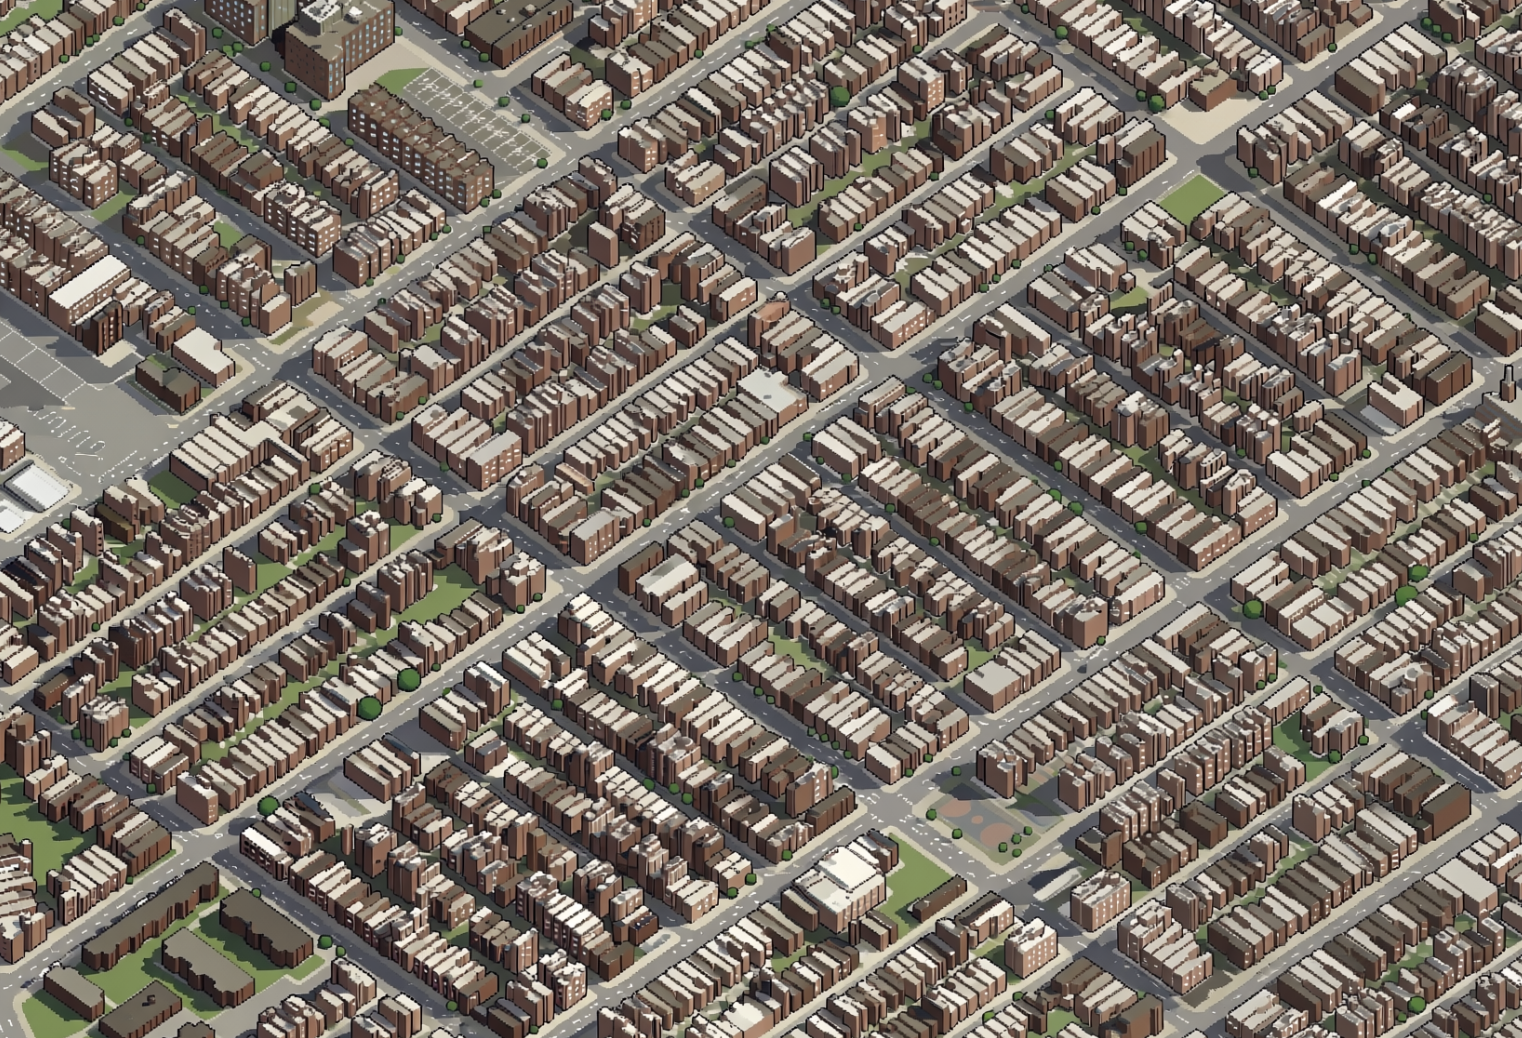
Exploring Isometric Philly
Train the visual model (Qwen)
- My one public data hiccup: Google Gemini was used to build models to direct Qwen.
- Why use Qwen? It is an open-source image model. Qwen is supplied model images and all remaining data; draws pixel style across city segment-by-segment.
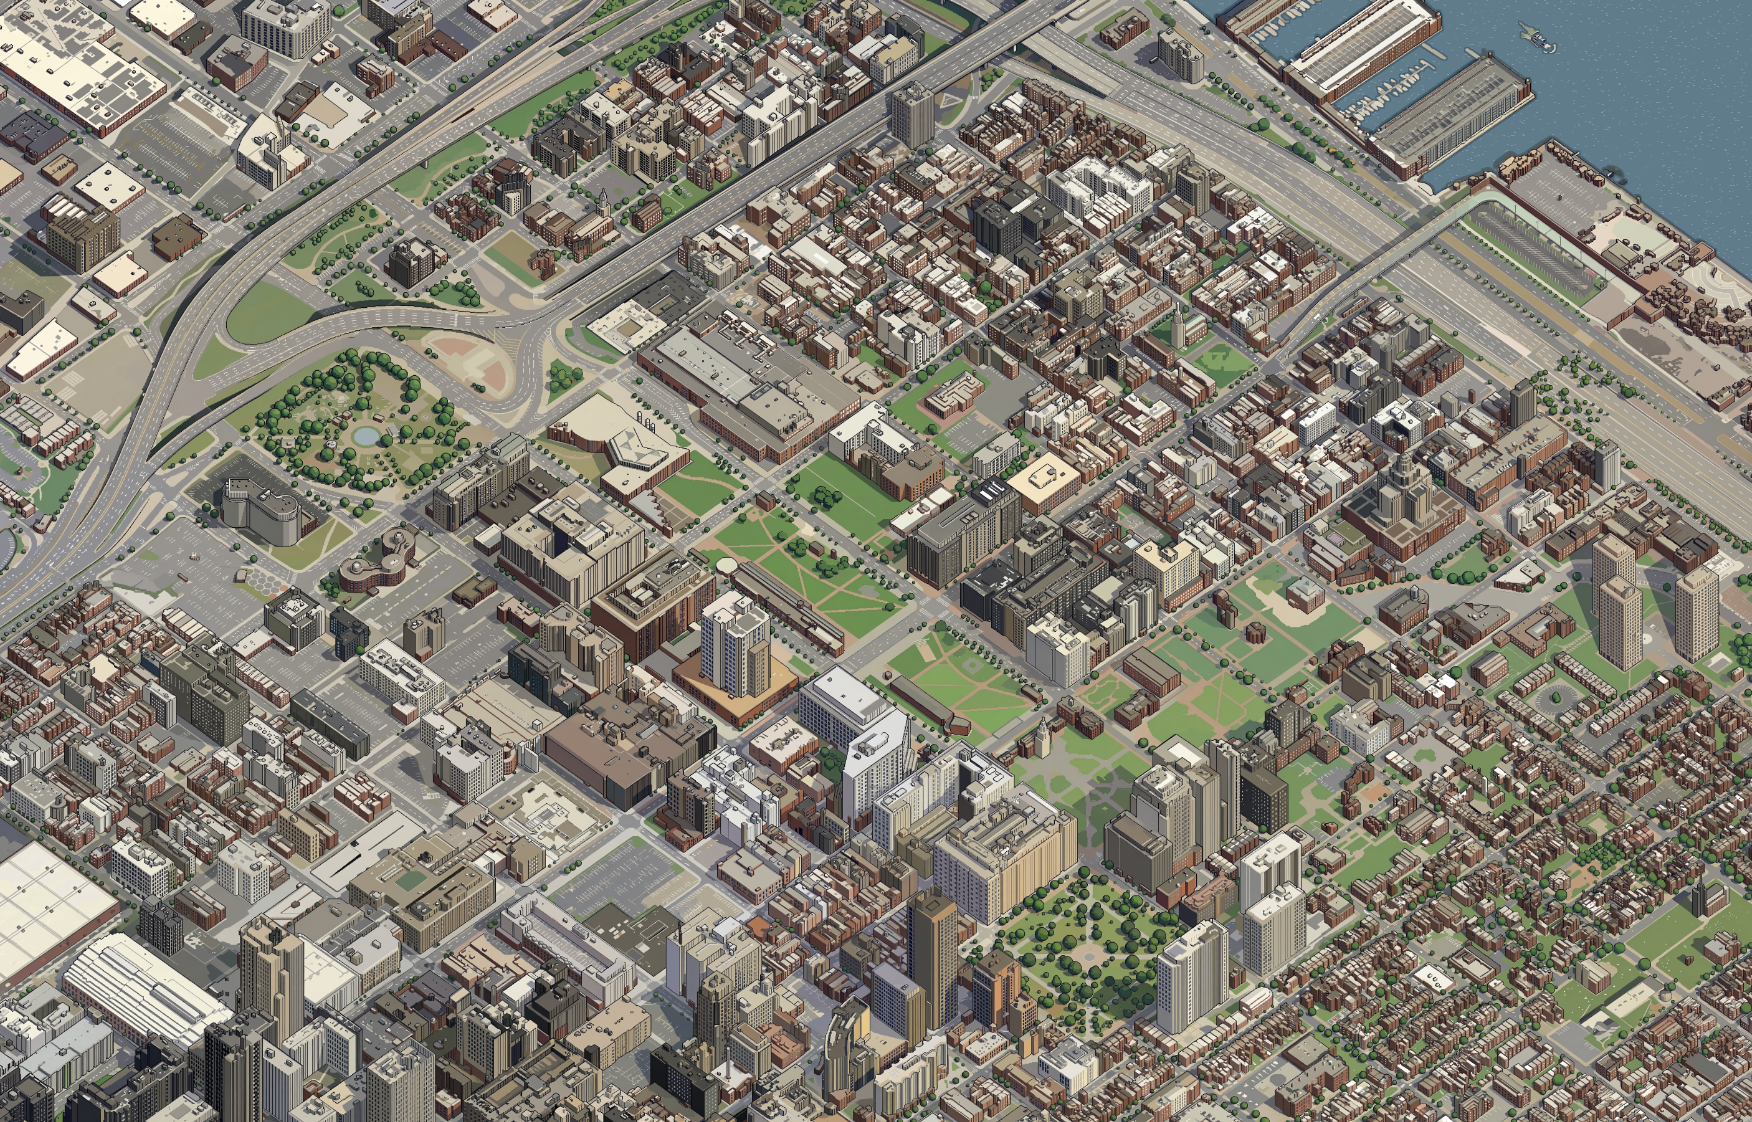
Exploring Isometric Philly
Start with a sample, and build out
- Split the city into 15+ segments; LiDAR data for the city is about 850GB.
- Get city borders framework and place finished sections within.
- Each section takes 1-3 hours to process; $5-20 of GPU time, using Modal.
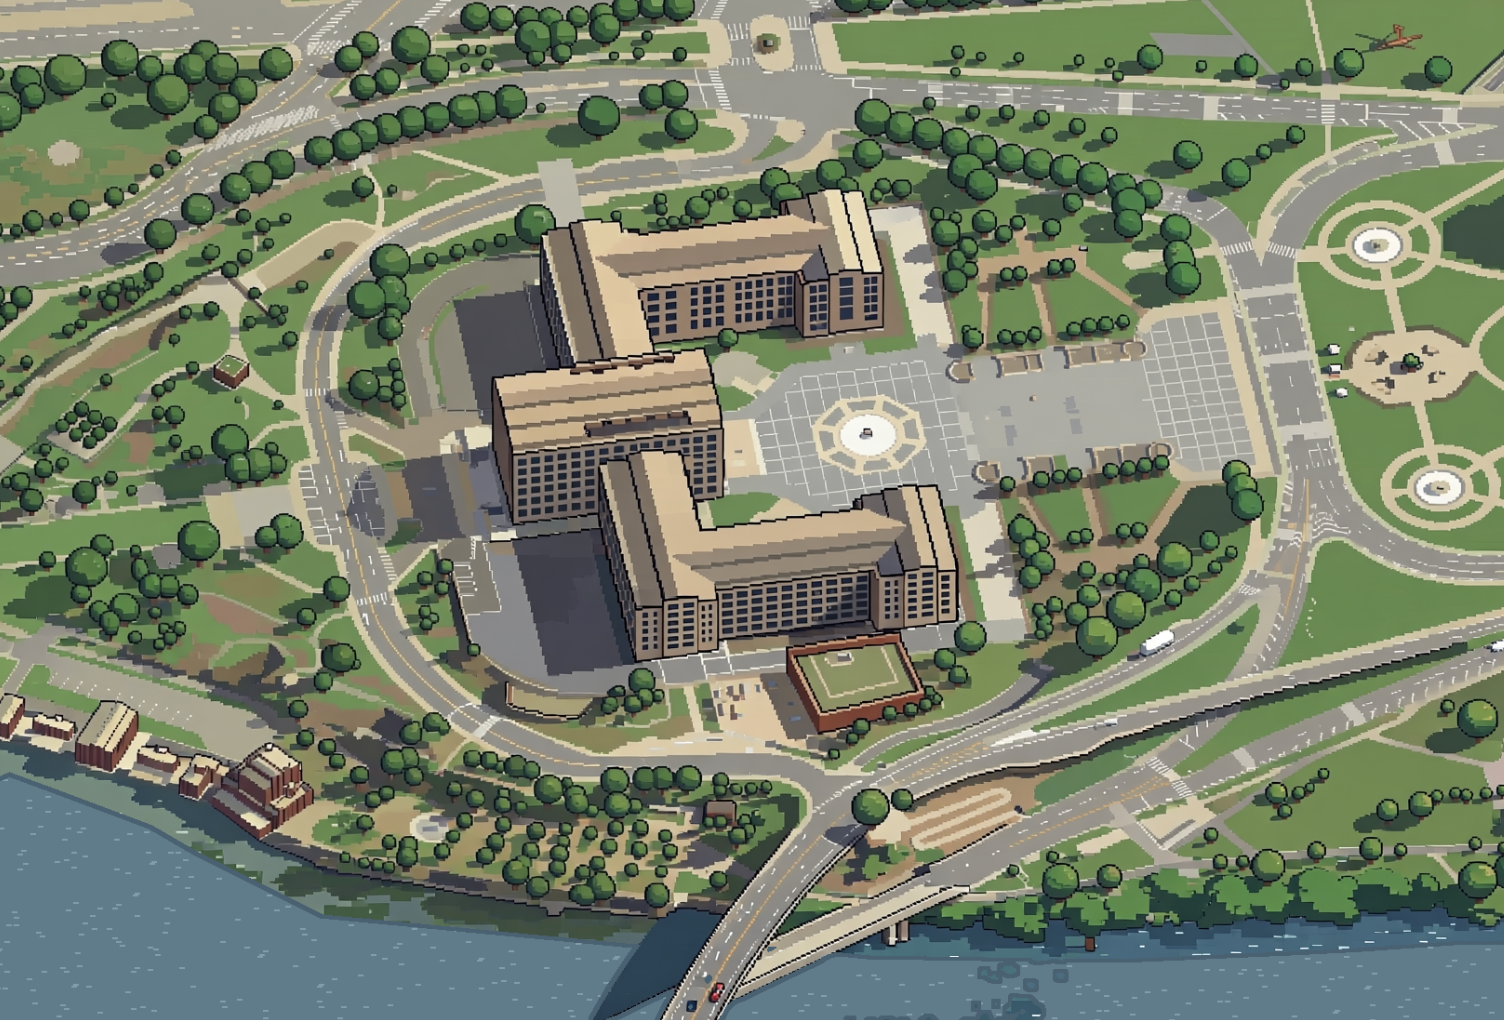
Exploring Isometric Philly
Refine, retrain on tricky territory
Your model will make ridiculous errors. Refinement is important.
Exploring Isometric Philly
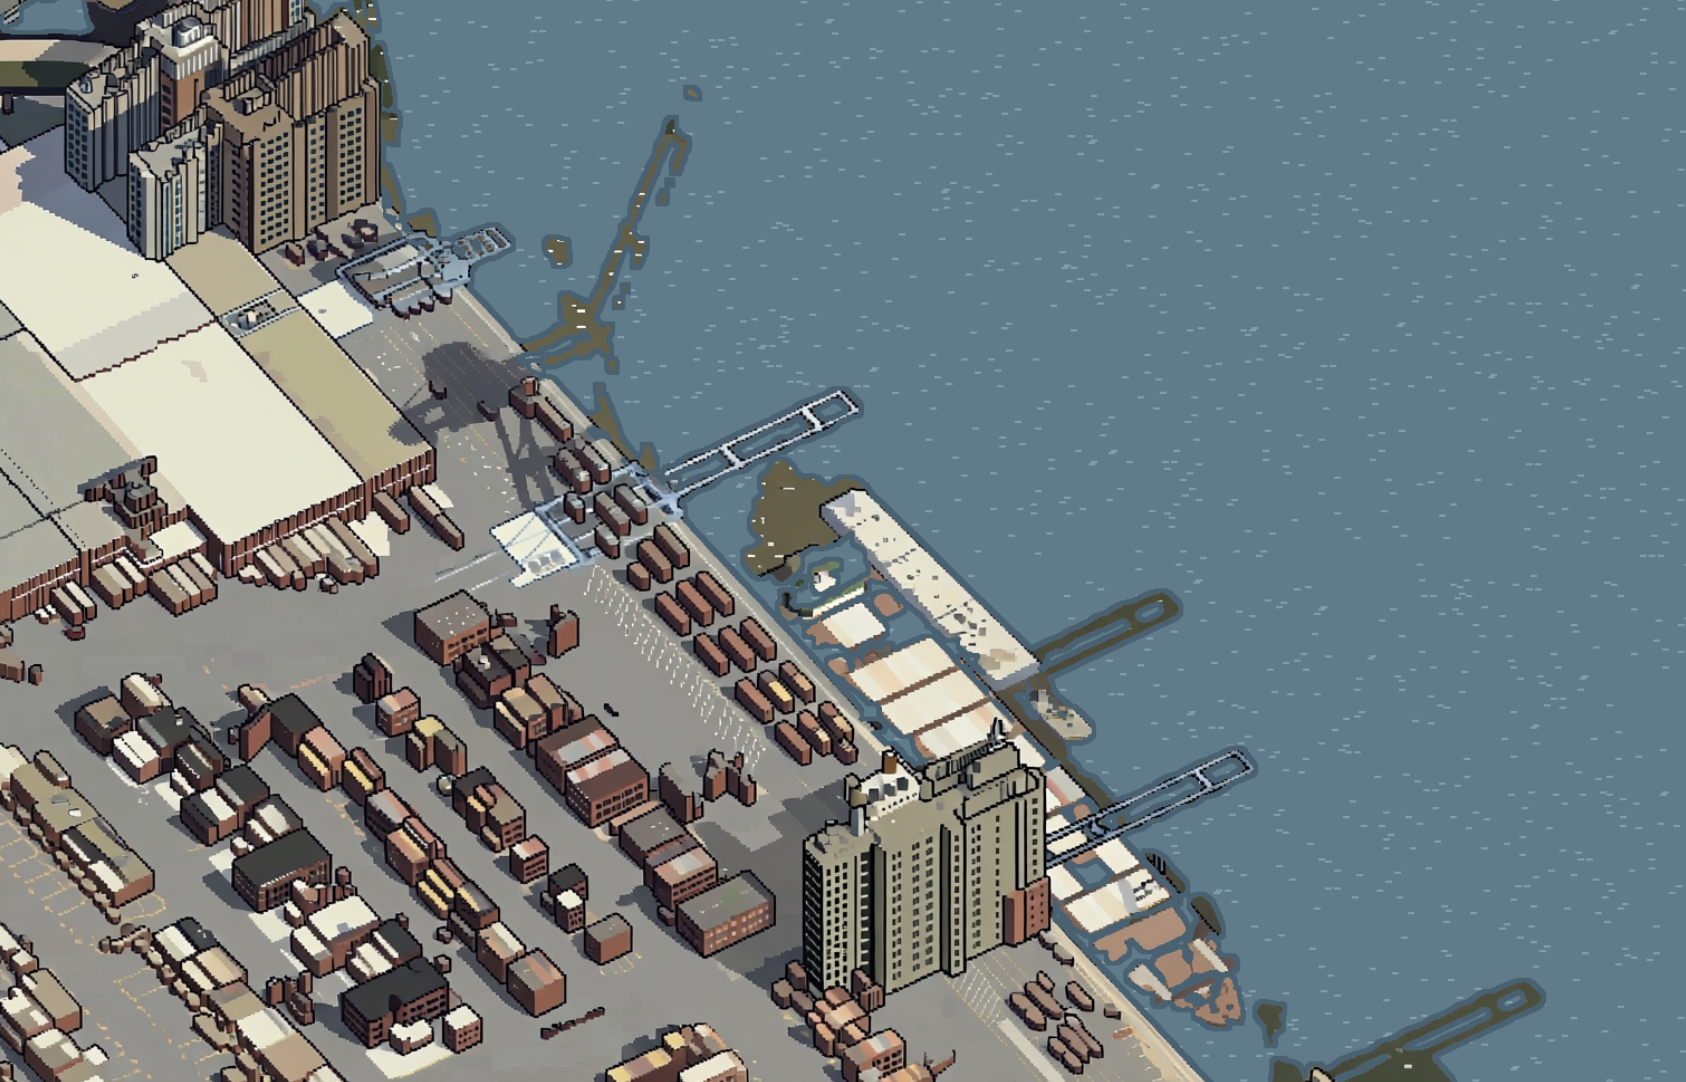
Draw SimPhilly (which will be called Pixel Philly for copyright reasons)
Loading map…
Exploring Isometric Philly
Explore it yourself!
- The Map: https://pixelphilly.sstirling.com
- The Code: https://github.com/sstirling/pixel-philly
- Costs: $149.71 in rented GPU processing. Claude Max 20x account.
- Time: 37.4 hours of processing across 3 weeks.
Questions
Questions?
- Email sstirling@inquirer.com
- Social @sstirling on most services
- Website https://sstirling.github.io
- Slides https://sstirling.github.io/prezis/presentations/worldplanningday/index.html